-
Technology
-
Industry
-
Solutions
-
- ASSET MANAGEMENT
- CUSTOMER EXPERIENCE MANAGEMENT
- CYBER SECURITY
- DATA CENTER
- DOCUMENT MANAGEMENT
- ELECTRONIC DATA INTERCHANGE
- ENTERPRISE DATA MANAGEMENT
- ENTERPRISE RESOURCE PLANNING
- ENTERPRISE RISK MANAGEMENT
- ENTERPRISE-GRADE WEB DATA SOLUTIONS
- FACILITY MANAGEMENT
- FIELD SERVICE
- IDENTITY AND ACCESS MANAGEMENT
- INFRASTRUCTURE
- IT SERVICE MANAGEMENT
- MANAGED IT SERVICES
- PAYMENT AND CARD
- PROJECT MANAGEMENT
- SOFTWARE TESTING
- STORAGE
- VIDEO SOLUTIONS
- WORKFLOW
-
-
Platforms
-
Functions
- Leadership Perspectives
- Innovation Insights
- Research
- Magazines
- News
- CXO Awards



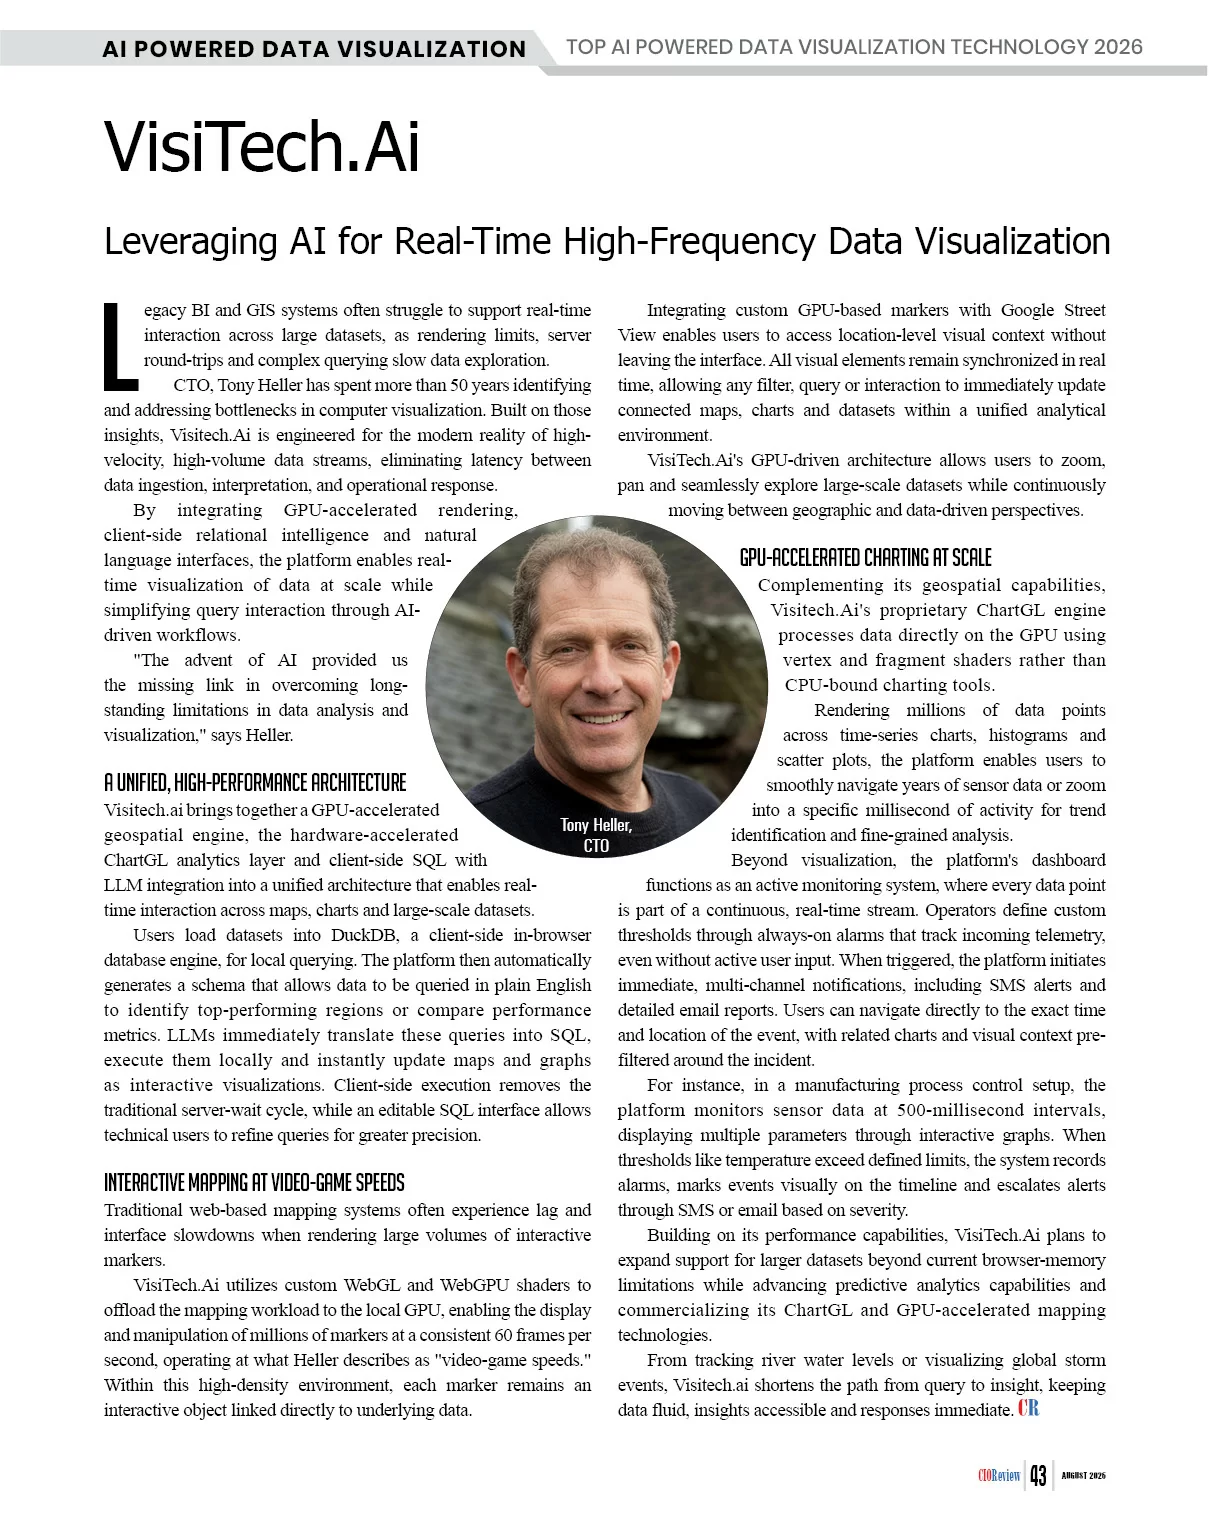
 Tony Heller, CTO
CTO, Tony Heller has spent more than 50 years identifying and addressing bottlenecks in computer visualization. Built on those insights, Visitech.Ai is engineered for the modern reality of high-velocity, high-volume data streams, eliminating latency between data ingestion, interpretation, and operational response.
By integrating GPU-accelerated rendering, client-side relational intelligence and natural language interfaces, the platform enables real-time visualization of data at scale while simplifying query interaction through AI-driven workflows.
"The advent of AI provided us the missing link in overcoming long-standing limitations in data analysis and visualization," says Heller.
A Unified, High-Performance Architecture
Visitech.ai brings together a GPU-accelerated geospatial engine, the hardware-accelerated ChartGL analytics layer and client-side SQL with LLM integration into a unified architecture that enables real-time interaction across maps, charts and large-scale datasets.
Users load datasets into DuckDB, a client-side in-browser database engine, for local querying. The platform then automatically generates a schema that allows data to be queried in plain English to identify top-performing regions or compare performance metrics. LLMs immediately translate these queries into SQL, execute them locally and instantly update maps and graphs as interactive visualizations. Client-side execution removes the traditional server-wait cycle, while an editable SQL interface allows technical users to refine queries for greater precision.
Interactive Mapping at Video-Game Speeds
Traditional web-based mapping systems often experience lag and interface slowdowns when rendering large volumes of interactive markers.
VisiTech.Ai utilizes custom WebGL and WebGPU shaders to offload the mapping workload to the local GPU, enabling the display and manipulation of millions of markers at a consistent 60 frames per second, operating at what Heller describes as "video-game speeds." Within this high-density environment, each marker remains an interactive object linked directly to underlying data.

The advent of AI provided us the missing link in overcoming long-standing limitations in data analysis and visualization.

Integrating custom GPU-based markers with Google Street View enables users to access location-level visual context without leaving the interface. All visual elements remain synchronized in real time, allowing any filter, query or interaction to immediately update connected maps, charts and datasets within a unified analytical environment.
VisiTech.Ai's GPU-driven architecture allows users to zoom, pan and seamlessly explore large-scale datasets while continuously moving between geographic and data-driven perspectives.
GPU-Accelerated Charting at Scale
Complementing its geospatial capabilities, Visitech.Ai's proprietary ChartGL engine processes data directly on the GPU using vertex and fragment shaders rather than CPU-bound charting tools.
Rendering millions of data points across time-series charts, histograms and scatter plots, the platform enables users to smoothly navigate years of sensor data or zoom into a specific millisecond of activity for trend identification and fine-grained analysis.
Beyond visualization, the platform's dashboard functions as an active monitoring system, where every data point is part of a continuous, real-time stream. Operators define custom thresholds through always-on alarms that track incoming telemetry, even without active user input. When triggered, the platform initiates immediate, multi-channel notifications, including SMS alerts and detailed email reports. Users can navigate directly to the exact time and location of the event, with related charts and visual context pre-filtered around the incident.
For instance, in a manufacturing process control setup, the platform monitors sensor data at 500-millisecond intervals, displaying multiple parameters through interactive graphs. When thresholds like temperature exceed defined limits, the system records alarms, marks events visually on the timeline and escalates alerts through SMS or email based on severity.
Building on its performance capabilities, VisiTech.Ai plans to expand support for larger datasets beyond current browser-memory limitations while advancing predictive analytics capabilities and commercializing its ChartGL and GPU-accelerated mapping technologies.
From tracking river water levels or visualizing global storm events, Visitech.ai shortens the path from query to insight, keeping data fluid, insights accessible and responses immediate.
The New Standard in AI-Driven Data Visualization
Enterprises are generating more data than ever, yet the ability to interpret that data in real time remains uneven across organizations. Traditional visualization tools often fragment insight generation, forcing users to move between dashboards, query interfaces and static charts. This disjointed experience slows decision cycles and places a premium on technical expertise, leaving non-specialists dependent on data teams. For executives evaluating AI-powered data visualization technology, the challenge lies not in access to data, but in how quickly and intuitively that data can be transformed into usable intelligence.
The expectation is no longer limited to visual representation but extends to dynamic exploration, where maps, charts and datasets respond instantly to user interaction. Real-time responsiveness becomes essential when dealing with high-density datasets, particularly in use cases such as geospatial tracking or process monitoring. Systems that rely on traditional rendering approaches struggle under this load, creating latency that disrupts analytical flow. In contrast, GPU-accelerated environments capable of handling large volumes of data points while maintaining fluid interactivity allow users to navigate complexity without friction.
Ease of interaction has also become central to adoption. Natural language querying is reshaping how users engage with data, enabling non-technical stakeholders to extract insights without relying on structured query languages. However, this capability must coexist with precision and control. Platforms that expose generated queries for user refinement allow both novice and experienced users to operate within the same environment, ensuring flexibility without sacrificing accuracy. The ability to move seamlessly between guided exploration and direct query manipulation reflects a broader expectation that visualization tools should adapt to varying levels of user expertise rather than enforce a rigid workflow.
Equally important is the speed at which insight can be generated once data is loaded. Systems that process datasets locally and execute queries in memory reduce dependency on external infrastructure, resulting in faster turnaround times. This approach supports rapid iteration, where users can test hypotheses, adjust filters and immediately observe outcomes. In operational contexts such as manufacturing or transaction monitoring, this immediacy is critical. Continuous data streams require visualization tools that display information, surface anomalies and trigger alerts in real time, allowing organizations to respond before minor deviations escalate into larger issues.
Automation is another defining characteristic of advanced solutions. Automated dashboard creation and intelligent query suggestions shorten the path from data ingestion to actionable insight. By interpreting dataset structures and proposing relevant lines of inquiry, systems can guide users toward meaningful analysis even when they lack domain familiarity. This reduces onboarding time and encourages broader usage across teams, turning data visualization from a specialized function into an accessible organizational capability.
VisiTech.Ai aligns closely with these evolving expectations through a platform built around speed, interactivity and user adaptability. It combines GPU-accelerated mapping and graphing with a natural language interface that converts user queries into executable analysis, enabling rapid insight generation directly within the browser. Its ability to handle large volumes of visual elements at high frame rates supports real-time exploration without performance degradation. The platform also balances accessibility with precision by allowing users to refine generated queries, while automated dashboards and intelligent suggestions accelerate initial engagement. For organizations prioritizing immediate, interactive access to their data, it presents a compelling and technically grounded option....Read more
AI-Powered Data Visualization Technologies Info
Q1
What Are AI-Powered Data Visualization Technologies?
AI-Powered Data Visualization Technologies use artificial intelligence to turn complex datasets into interactive charts, dashboards, visual reports and insights that are easier to understand. These technologies can automate parts of the analytics process through machine learning, natural language interaction and intelligent data interpretation, helping organizations identify patterns, explore trends and communicate information more clearly.
Q2
How Does VisiTech AI Advance AI-Powered Data Visualization Technologies?
VisiTech AI advances AI-Powered Data Visualization Technologies by enabling users to explore data through intuitive, browser-based interactions. Its platform allows users to ask questions in natural language, generate visualizations such as charts, maps and dashboards and analyze information without relying on complex coding or manual reporting workflows. This approach helps users move from raw data to clearer insights more efficiently.
Q3
What Should Organizations Consider When Selecting AI-Powered Data Visualization Technologies?
When evaluating AI-Powered Data Visualization Technologies, organizations should consider data accessibility, visualization accuracy, automation capabilities, ease of use, scalability and compatibility with existing analytics environments. Solutions that help business users explore information independently while maintaining reliable data interpretation can make analysis more accessible across teams.
Q4
Why Are AI-Powered Data Visualization Technologies Important for Modern Analytics?
AI-Powered Data Visualization Technologies help organizations understand complex information without relying only on traditional reporting methods. Automated visualization generation, interactive dashboards and trend identification allow users to uncover relationships within datasets faster. This reduces the time spent preparing reports manually and gives teams more opportunity to focus on interpreting information and making decisions.
Q5
How Does VisiTech AI Support Data-Driven Decision-Making?
VisiTech AI supports AI-Powered Data Visualization Technologies through automated chart generation, natural language data exploration and browser-based analytics. The platform allows users to upload and analyze data, create visual representations, apply filters, compare datasets and identify patterns through interactive exploration. These capabilities help organizations extract clearer insights from their existing information.
Q6
How Are AI-Powered Data Visualization Technologies Evolving?
Today's AI-Powered Data Visualization Technologies are advancing through generative AI, automated insight discovery, conversational analytics and intelligent dashboard creation. These developments allow users to interact with data through natural language while making it easier to identify trends, anomalies and opportunities without requiring advanced technical expertise.
Company
Visitech.Ai
Management
Dave Lehman, CEO, Tony Heller, CTO and David Heller, Chief Data Scientist.
Description
VisiTech.Ai provides an AI-driven platform for real-time visualization and interaction across large-scale, high-frequency datasets. Combining GPU-accelerated rendering, client-side processing and natural language querying, it enables fast geospatial exploration and analytical workflows through interactive maps and charts.