-
Technology
-
Industry
-
Solutions
-
- ASSET MANAGEMENT
- CUSTOMER EXPERIENCE MANAGEMENT
- CYBER SECURITY
- DATA CENTER
- DOCUMENT MANAGEMENT
- ELECTRONIC DATA INTERCHANGE
- ENTERPRISE DATA MANAGEMENT
- ENTERPRISE RESOURCE PLANNING
- ENTERPRISE RISK MANAGEMENT
- ENTERPRISE-GRADE WEB DATA SOLUTIONS
- FACILITY MANAGEMENT
- FIELD SERVICE
- IDENTITY AND ACCESS MANAGEMENT
- INFRASTRUCTURE
- IT SERVICE MANAGEMENT
- MANAGED IT SERVICES
- PAYMENT AND CARD
- PROJECT MANAGEMENT
- SOFTWARE TESTING
- STORAGE
- VIDEO SOLUTIONS
- WORKFLOW
-
-
Platforms
-
Functions
- Leadership Perspectives
- Innovation Insights
- Research
- Magazines
- News
- CXO Awards











Contributory Virtus Investment Partners on the invitation from our Editorial

Balluff worldwide
Tom Knauer, Business Strategy Manager for Assembly, Robotics & AutomationIdentifying Equipment Failures Before They Occur
Tom Knauer, Business Strategy Manager for Assembly, Robotics & Automation

Condition monitoring sensors provide data on machine conditions, always keeping operators informed and allowing them to plan repairs and perform preventive maintenance.
The P-F curve is often mentioned in condition monitoring and predictive maintenance discussions where “P-F” refers to the interval between the detection of a potential failure (P) and the occurrence of a functional failure (F). It shows the different stages of an asset’s life, how failures progress, and how and when different symptoms emerge which might signal impending (or actual) failure.
At first, performance degradation is minor and may not require significant action. As time progresses, the potential failure indicators become stronger and more easily detectable, and the performance degradation becomes more severe, eventually ending in catastrophic failure.
The timeline is split into three domains:
• Proactive domain with activities including designing for reliability, precision installation and alignment, and life cycle asset management.
• Predictive domain in which timely action may be taken to prevent failure or replace failing equipment before catastrophic failure occurs.
• Fault domain when symptoms indicate immediate action is necessary to address occurring or inevitable failure.
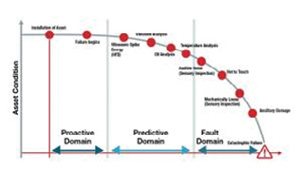 During these domains, different indicators/symptoms emerge. Ultrasonic, vibration and oil analysis often signal problems early; then temperatures rise and noises emerge a bit later; and finally, parts come loose and more severe damage occurs. Depending on the asset, other indicators may be shown by activities including corrosion monitoring, motor current/power analysis and process parameter trending (e.g., flows, rates, pressures, temperatures, etc.).
By analyzing which symptoms of failure are likely to appear in the predictive domain for a given piece of equipment, you can determine which failure indicators to prioritize in your own condition monitoring and predictive maintenance discussions.
 Technology providers are continually improving condition monitoring and predictive solutions. By lowering condition monitoring system costs and making them easier to set up and use, users can cost-effectively move from Reactive reactive or Preventative preventative approaches to condition-based or predictive approaches
In general, the goal is to maximize the P-F interval, which is the time between the first symptoms of impending failure and the functional failure taking place. In other words, you want to become aware of an impending failure as soon as possible to allow more time for action. This, however, must be balanced with the cost of the methods of prevention, inspection, and detection.
Cost-benefit tradeoffs
There is a trade-off between the cost of systems to detect and predict the failures and how soon you might detect the condition. Generally, the earlier the detection/prediction, the more expensive it is. However, the longer it takes to detect an impending failure (i.e. the more the asset’s condition degrades), the more expensive it is to repair.
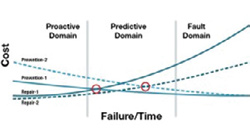 Every asset will have a unique trade-off between the cost of failure prevention (detection/prediction) and the cost of failure. This means some assets probably call for earlier detection methods that come with higher prevention costs like condition monitoring and analytics systems due to the high cost to repair (see the Prevention-1 and Repair-1 curves in the Cost-Failure/ Time chart). And some assets may be better suited for more cost-efficient but delayed detection or even a “run-to-failure” model due to lower cost to repair (the Prevention-2 and Repair-2 curves).
There are four basic maintenance approaches:
Reactive
The Reactive approach has low or even no cost to implement but can result in a high repair/ failure cost because no action is taken until the asset has reached a fault state. This approach might be appropriate when the cost of monitoring systems is very high compared to the cost of repairing or replacing the asset. As a general guideline, the Reactive approach is not a good strategy for any critical and/or high value assets due to their high cost of a failure.
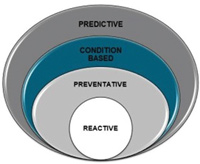 Preventative
The Preventative approach (maintenance at time-based intervals) may be appropriate when failures are age related and maintenance can be performed at regular intervals before anticipated failures occur. Two drawbacks to this approach are: 1) the cost and time of preventative maintenance can be high; and 2) studies show that only 18% of failures are age related (source: ARC Advisory Group). 82% of failures are “random” due to improper design/ installation, operator error, quality issues, machine overuse, etc. This means that taking the Preventative approach may be spending time and money on unnecessary work, and it may not prevent expensive failures in critical or high value assets.
Condition-based
The Condition-based approach attempts to address failures regardless of whether they are age-based or random. Assets are monitored for one or more potential failure indicators, such as vibration, temperature, current/voltage, pressure, etc. The data is often sent to a PLC, local HMI, special processor, or the cloud through an edge gateway. Predefined limits are set and alerts (alarm, operator message, maintenance/ repair) are only sent when a limit is reached. This approach avoids unnecessary maintenance and can give warning before a failure occurs. Condition-based monitoring can be very cost-effective, though very sophisticated solutions can be expensive. It is a good solution when the cost of failure is medium or high and known indicators provide a reliable warning of impending failure.
Predictive analytics
Predictive analytics is the most sophisticated approach and attempts to learn from machine performance to predict failures. It uses data gathered through condition monitoring, and then applies analysis or AI/machine learning to uncover patterns to predict failures. The hardware and software to implement predictive analytics can be expensive, and this method is best for high-value/critical assets and expensive potential failures.
Each user must evaluate the unique attributes of their assets and decide on the best approach and trade-offs of the cost of prevention (detection of potential failure) against the cost of repair/failure. In general, a Reactive approach is only best when the cost of failure is very low. Preventative maintenance may be appropriate when failures are clearly age-related. And advanced approaches, such as condition-based monitoring and Predictive analytics are best when the cost of repair or failure is high.
Also note that technology providers are continually improving condition monitoring and predictive solutions. By lowering condition monitoring system costs and making them easier to set up and use, users can cost-effectively move from Reactive or Preventative approaches to condition-based or predictive approaches.
The articles from these contributors are based on their personal expertise and viewpoints, and do not necessarily reflect the opinions of their employers or affiliated organizations.
EDITOR'S Choice

Fortune Brands Innovations [NYSE: FBIN]
By Juan Guerrero, Director, IT Audit & Data Analytics
The IT Audit Evolution: From Compliance to Strategic Intelligence
Broad River Retail
Wes Dudley, Senior Vice President, Customer Experience
Customer Experience in the Age of Amplified Complexity
Fortune Brands Innovations [NYSE: FBIN]
Scott Barnes, Sr. Director of Enterprise Cyber Security (CISO)
The X-Factor in Cybersecurity: AI and Automation at Work

LHarris Technologies [NYSE: LHX]
Brian Allred, Director of Business Intelligence and Analytics
The Shift from Rigid Dashboards to Conversational Analytics
Ivar's Restaurants
Patrick Yearout, Director of Innovation, Recruitment & Training
From Hiring to Development: Nurturing Teams that CareLatest Issues


